STUDY/Data Engineering
[kodekloud] 03 Monitor Cluster Components 풀이
wonpick
2023. 1. 24. 16:14
Q1. We have deployed a few PODs running workloads. Inspect them.
Wait for the pods to be ready before proceeding to the next question.
Q2.Let us deploy metrics-server to monitor the PODs and Nodes. Pull the git repository for the deployment files.

Q3. Deploy the metrics-server by creating all the components downloaded. Run the kubectl create -f . command from within the downloaded repository.

이하는 답안인데 차이가 없는 걸까?
답안대로 하니 이미 존재한다고 한다.

Q4. It takes a few minutes for the metrics server to start gathering data.
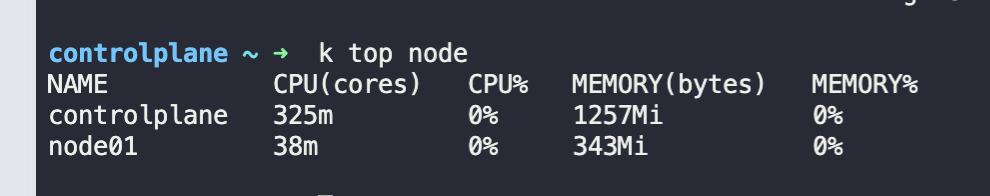
Q5. Identify the node that consumes the most CPU.
파드의 CPU 사용량은 kubectl top pod 명령을 통해 확인할 수 있다.
k top node --sort-by='cpu' --no-headers | head -1
Q6. Identify the node that consumes the mostMemory.
k top node --sort-by='memory'
Q7. Identify the POD that consumes the most Memory.
k top pod --sort-by='memory'
팁) kubectl top pod -l {LABEL}
-l 옵션과 레이블명을 추가하여 특정 레이블을 가진 파드의 CPU 사용량을 조회할 수 있다.
Q8. Identify the POD that consumes the least CPU.
kubectl top pod --sort-by='cpu' --no-headers | tail -1